|
79Score
Getting your Trinity Audio player ready...
|
The PTE Describe Image task can be one of the most challenging sections in the PTE Speaking module, requiring quick thinking and structured responses. In this task, you will see an image—such as a bar chart, line graph, map, or diagram—and must describe its key details within 40 seconds, making regular PTE exam practice essential for success.
To help you ace this section, we’ve compiled essential tips, a proven template, and some predictive questions with sample answers. Whether you’re a beginner or aiming for a high score, this guide will boost your confidence and improve your performance in the PTE Describe Image task.
| Prompt Length | Skills Assessed | No. Questions | Traits Scored |
| Not Applicable | Speaking | 3-4 | Content, Oral Fluency, Pronunciation |
PTE Describe Image Template 2026
Introduction (1 sentence):
- The given image is a (bar chart/line graph/pie chart/diagram/map/table) that illustrates (mention the main topic).
Key Features (2-3 sentences):
- The image presents information about (describe the main trend or pattern).
- The highest (or lowest) value is observed in (mention category) with (mention value if applicable).
- There is a significant (increase/decrease/variation) in (mention any noticeable trend or change).
Comparison/Trends (1-2 sentences):
- Comparing different elements, (mention similarities or differences).
- A notable trend is that (describe any major change or outlier).
Conclusion (1 sentence):
- In summary, the image provides valuable insights into (restate the main theme briefly).
Not sure where you stand? Take a free PTE mock and find out instantly

- Get a complete performance breakdown instantly
- Access 30,000+ Free Question Wise Practice
PTE Describe Image Tips to Score High
Focus on Key Features
- Do not describe everything. Identify trends, highest & lowest values, comparisons, and major changes instead of explaining every detail.
Use Connectors for Coherence
- Use linking words like “overall,” “compared to,” “on the other hand,” “in contrast,” to maintain fluency and structure.
Maintain a Steady Pace
- Speak at a natural speed—neither too fast nor too slow—to avoid hesitations or unnatural pauses.
Avoid Filler Words
- Do not say “umm,” “like,” or repeat words. If you get stuck, pause briefly and continue without breaking fluency.
Use the Right Grammar & Vocabulary
Use simple but effective phrases like:
- “The graph shows…”
- “There is a significant increase in…”
- “The highest percentage is recorded in…”
Speak Clearly & Confidently
- Pronounce words correctly and avoid a monotone voice. A slight variation in tone makes the response sound more natural.
Don’t Worry About Data Accuracy
- If you forget an exact number, approximate it rather than pausing or struggling to recall.
PTE Describe Image Predictive Question and Answer
PTE Describe Image Example 1

Description: This picture gives information about an amusement park. From the picture we can see there is a large Ferris wheel in the middle of the amusement park. In front of it there is a merry-go-round. Behind the Ferris wheel we can see a roller coaster track, which is blue. In the background we can see a huge castle and some white clouds are above in the sky. There are two tents on the lawn as well as some colorful balloons. It is sunny. In conclusion, this picture is informative.
PTE Describe Image Example 2

Description: The picture gives information about a public garden. There is a big tree in the middle of the picture, and there are a parent and a little girl reading under the tree. From the picture we can see a pet dog is running after a runner in shorts. In the blue sky, there is a kite flying high overhead. There are some benches on the large lawn, and people sit on them to have a rest. It is a sunny day, and there are high buildings in the background. In conclusion, this picture is very informative.
PTE Describe Image Example 3
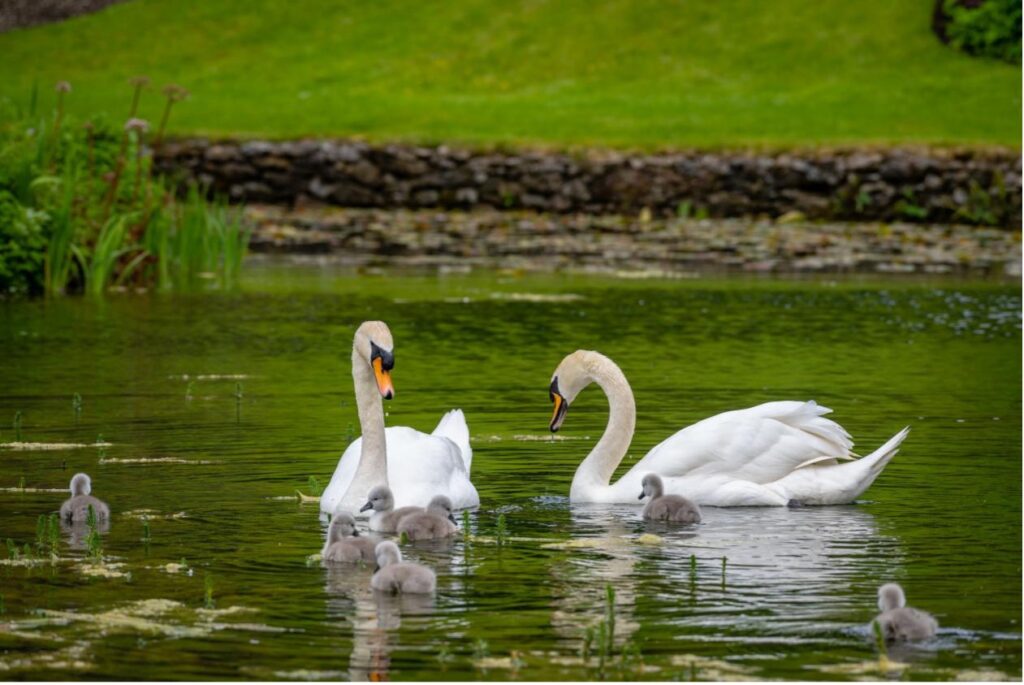
Description: The picture gives information about a family of swan. In the middle of the picture there is a couple of swans, whose color is white. There are seven baby swans swimming around the parents, whose color is grey. From the picture we can see the pond is green. There is some aquatic grass on the water surface. In the background we can see a stretch of green lawn on the bank. In conclusion, this picture is very informative.
PTE Describe Image Example 4

Description: The picture gives information about a view of sunset. In the lower left corner there is an old man is taking a picture of the sunset, with arms holding a cellphone up. This old man is in a chequered shirt, and has a red bag on the back. In front of him there is a row of fence. There is another man in a chequered shirt, and there is a man in dark blue taking photos with a digital camera. Below them, it is a large city which presents a wonderful urban landscape. In conclusion, this picture is very informative.
PTE Describe Image Example 5

Description: This picture gives information about human anatomy. Firstly, the cross-section of the nose is shown in the head. Below the nose, that of the mouth is shown, too. Then, that of the Trachea is shown between the mouth and the lungs. From the picture we can see the two lungs are pink, with many thin blood vessels within them. Below the lungs there is the diaphragm, which separate the chest and the belly. The upper halves of the two arms are also shown in the picture. In conclusion, this picture is very informative.
PTE Describe Image Example 6

Description: This picture gives information of a meandering river. We can see in the middle of picture there is a blue river meandering in high waves. On one side of the river, there stands a high cliff, from which rainfall washes sand down into the river. Across the river the bank forms a bulge towards the river, which is called neck. The neck forms because the sand washed into the river accumulates. In conclusion, this picture shows why a river meanders.
PTE Describe Image Example 7

Description: This picture gives information of major transportation in modern society. We can see between fifteen hundred and eighteen hundred the major transportation was the carriage powered by horses. Since eighteen hundred the bicycle has been around in people’s lives. Then the train was invented and began to play a major role in transportation. From two thousand the bicycle and the car have been the major transportations. We can see three types of cars in the bottom line. In conclusion, this picture is very informative.
PTE Describe Image Example 8
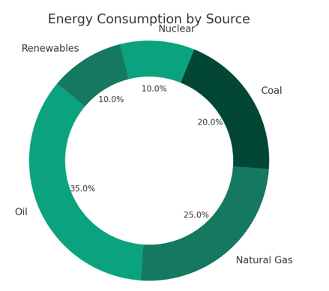
Description: The given donut chart illustrates the distribution of energy consumption by source. Oil is the dominant energy source, accounting for 35%, followed by natural gas at 25%. Coal contributes 20%, while both renewables and nuclear energy make up 10% each. Fossil fuels (oil, natural gas, and coal) constitute 80% of total energy use, highlighting a reliance on non-renewable resources. In contrast, cleaner alternatives like renewables and nuclear energy remain limited. This chart emphasizes the need for a transition towards sustainable energy sources to reduce environmental impact.
PTE Describe Image Example 9

Description: The given line graph illustrates the student and teacher growth rates from 2010 to 2020. The student growth rate (green) fluctuates between 2.5% and 5%, while the teacher growth rate (blue) remains lower, ranging from -0.5% to 2.5%. Both trends show periodic increases and declines, with student growth consistently higher than teacher growth. The most significant decline in teacher growth occurs after 2014, while student growth rises after 2018. Overall, the graph highlights an imbalance in student and teacher growth rates over the years.
PTE Describe Image Example 10

Description: The given pie chart represents the corporate budget distribution across various departments. R&D receives the highest allocation at 25%, followed by Marketing with 20%. IT Support and Human Resources each receive 15%, while Administration and Sales are allocated 10% each. The Other category has the smallest share at 5%. The chart highlights that a significant portion of the budget is invested in R&D and Marketing, while smaller allocations are given to Administration, Sales, and miscellaneous expenses.
Experience real-time exam simulations on 79score and get familiar with the actual test format—practice with section-wise tests featuring instant scoring and give free mock test for pte to maximize your score. Stay updated daily—join our Telegram channel and follow us on social media.
Conclusion:
Mastering the PTE Describe Image task requires a structured approach, quick thinking, and confidence in your response. By following the provided tips, using the proven template, and practicing predictive questions on the best platform for pte preparation- 79score, you can enhance your speaking skills and improve your overall score. Stay consistent with your PTE practice, focus on key details, and refine your fluency to excel in this section. Keep learning, stay motivated, and make the most of our real-time exam simulations to achieve your target PTE score!
Also Read:
- PTE Essay Template, Tips & Practice Question & Answer For Scoring High
- List of Predictive PTE Answer Short Questions Examples With Trips & Tricks
- Crack PTE Pie Chart Questions – Tips, Template & Samples