

|
79Score
Getting your Trinity Audio player ready...
|
In the PTE Describe Image task, you will see various images like pie charts, bar graphs, table charts, etc., but students often find process charts a bit difficult to explain. A lot of students do fine with graphs but go blank the moment they see arrows and stages, mostly because they try to describe every box in detail instead of focusing on the flow. But the truth is PTE process charts are one of the easiest image types once you have a structure to fall back on.
Because the chart’s logic does most of the work for you, you just need to narrate it in the right order using the right connecting words. Here is an expert template, useful tips, and PTE questions with answers to help you prepare effectively.
Most Used Flow Chart Template
You don’t need to reinvent your opening line for every process chart. Here’s a structure that covers almost any version you’ll see in the PTE process chart describe image task:
Opening statement (say what the chart shows, in one sentence)
- “The given diagram illustrates the process of [topic].”
- “The image shows the various stages involved in [topic].”
Mention the number of stages
- “The process consists of [number] main stages, beginning with [first stage] and ending with [last stage].”
This one line does a lot of work – it tells the examiner you’ve understood the overall shape of the chart before you dive into detail.
Walk through the stages in order
- Use sequencing words instead of just listing: first, following this, once this is complete, subsequently, after that, next, finally.
- For each stage, describe what happens in a short clause rather than a full sentence – you don’t have time to explain the science behind it.
Example flow: “First, raw material is collected and transported to the factory. Following this, it goes through a sorting stage, where it is separated based on quality. Once this is complete, it moves to the processing unit…”
Mention any loops or branches, if present
- Some charts aren’t linear – they loop back (recycling processes are a classic example). If you spot a cycle, say so: “Interestingly, this is a cyclical process, as the final stage feeds back into the first.”
Closing statement
- “To conclude, the diagram outlines the complete process of [topic], from [first stage] to [final stage].”
That’s it – five parts, and you can run through all of them in well under a minute once you’ve practiced a couple of times.

Tips to Score High in PTE Process Chart
- Don’t try to describe every box. If the chart has ten stages, group similar ones together (“the next few stages all relate to quality checks”) rather than treating each as a separate sentence – you’ll run out of time otherwise.
- Practice your sequencing words out loud, not just in your head. Words like subsequently and following this need to come out smoothly, and that only happens with actual PTE speaking practice, not silent reading.
- Keep your tone flat and steady. This isn’t a task where you need dramatic emphasis – clear, even pacing scores better than trying to sound excited about a wastewater treatment diagram.
- Watch your time, not the chart. Many students get so absorbed in the visual that they forget the speaking window is closing
- Don’t guess technical vocabulary you’re unsure of. If you don’t know the exact term for a stage, describe it in simple words instead of mumbling through a word you’re not confident about.
- Use the arrows as your script. The chart is basically already telling you the order – your job is just to turn arrows into spoken sentences, not to add your own opinion or extra information.
- Record yourself during practice. It’s the fastest way to catch filler words, awkward pauses, or a rushed ending – things you genuinely can’t hear in your own head while speaking.
- End with a real closing line; don’t just trail off. A short wrap-up sentence signals to the examiner (and the scoring system) that your response is complete and organized.
Useful Vocabulary for PTE Flow Chart Task
| Purpose | Synonyms / Alternatives | Example |
| Starting the process | begins with, starts with, commences with, initiates with, opens with | “The process begins with the collection of raw materials.” |
| Showing sequence | first, firstly, initially, to begin with, at first | “Initially, the raw materials are collected.” |
| Next stage | next, then, afterwards, after that, subsequently, following this | “Subsequently, the material is sent for processing.” |
| Showing continuation | continues with, proceeds to, moves on to, goes on to, follows with | “The process proceeds to the heating stage.” |
| Following a stage | followed by, after which, following this, thereafter, subsequently | “This stage is followed by filtration.” |
| Showing transformation | changes into, converts into, transforms into, is turned into, is processed into | “The raw material is transformed into a finished product.” |
| Showing movement | moves to, passes to, goes to, is transferred to, is sent to | “The material is transferred to the processing unit.” |
| Showing a condition | once, when, after, as soon as, upon, following | “Once the product is inspected, it is packaged.” |
| Showing a decision | if, depending on, based on, according to, subject to | “Depending on the quality, the product moves to the next stage.” |
| Showing two paths | either…or, alternatively, otherwise, if not, in another case | “The material is either reused or sent for disposal.” |
| Showing repetition | repeated, repeated again, recurs, cycles back, loops back, returns to | “The process cycles back to the initial stage.” |
| Showing the final stage | finally, eventually, lastly, ultimately, in the final stage, at the end | “Ultimately, the finished product is delivered.” |
| Showing the outcome | results in, leads to, produces, creates, generates, ends with | “This stage leads to the production of electricity.” |
| Adding detail | where, in which, through which, by which, during which | “The water passes through a filter, where impurities are removed.” |
| Connecting stages | before, after, while, during, prior to, before moving to | “The product is tested before moving to the packaging stage.” |
Not sure where you stand? Take a free PTE mock and find out instantly


Process Chart PTE Describe Image Sample Questions and Answers
Question 1:

Answer 1:
This infographic explains five stages of a project in sequence. It starts with Planning & Research, focusing on defining goals, gathering information, and creating a timeline. Next is Design & Development, where ideas are conceptualized, built, and iterated. Testing & Quality Assurance follows, covering issue identification, bug fixing, and verification. Then comes Deployment & Launch, including release and going live. Finally, Monitoring & Maintenance tracks performance, collects feedback, and applies updates. Overall, it shows a complete project lifecycle from planning to long-term improvement.
Question 2:
Answer 2:
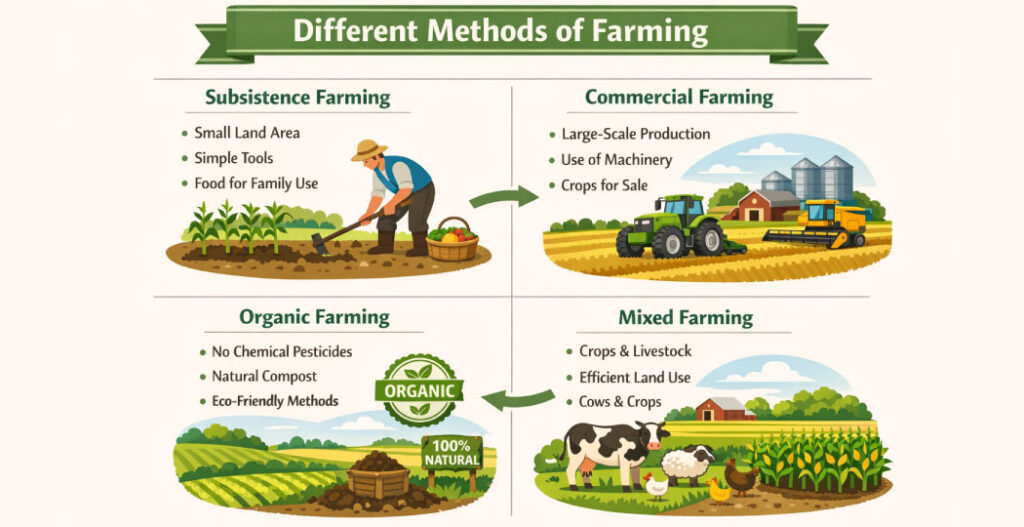
The infographic compares four farming styles. Subsistence farming uses a small land area, simple tools, and mainly produces food for family use. Commercial farming is large-scale, relies on machinery, and grows crops for sale. Organic farming avoids chemical pesticides, uses natural compost, and follows eco-friendly methods. Mixed farming combines crops and livestock, improving land efficiency with cows alongside crops. Overall, it highlights how goals and inputs change farming practices.
Question 3:
Answer 3:
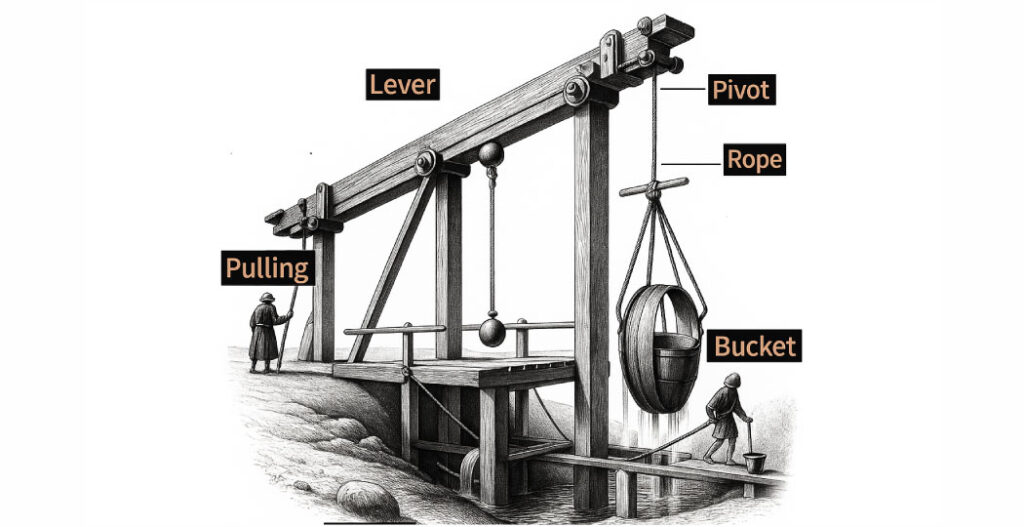
This diagram illustrates a lever mechanism used to lift water. A long wooden lever rests on a pivot acting as the fulcrum. One person applies force by pulling down on the left side, while a rope on the right side raises a heavy bucket from the well. Labels show the lever, pivot, rope, bucket, and the pulling action. The setup demonstrates mechanical advantage, making lifting easier. Overall, it explains how simple machines reduce effort.
Question 4:
Answer 4:
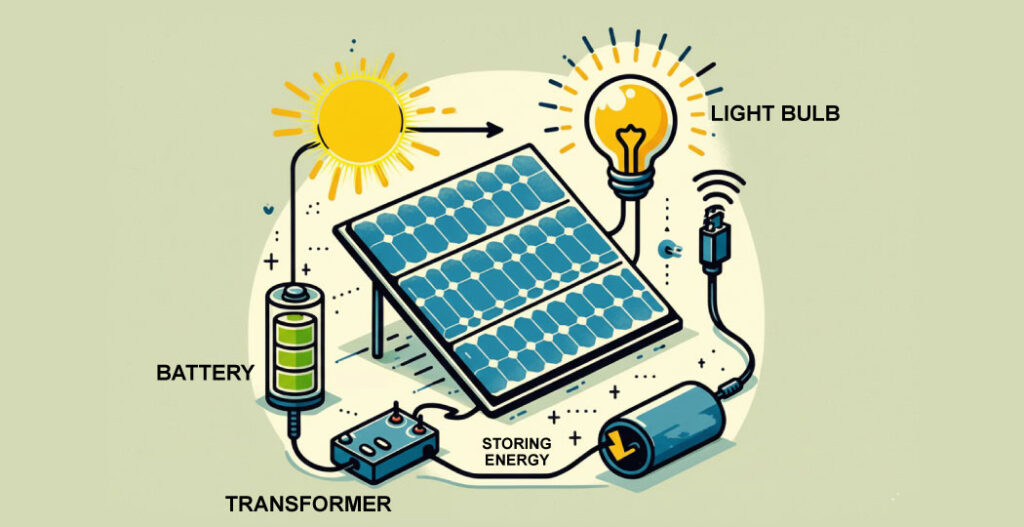
The diagram shows the flow of solar energy in a small system. Sunlight hits the solar panel, which converts light into electricity. The energy can be stored in a battery for later use, as indicated by the “storing energy” label. A transformer and control box help regulate and deliver power through a cable. Finally, the electricity runs a light bulb and other devices. Overall, it summarizes clean energy generation and storage.
Question 5:

Answer 5:
The diagram explains how a water wheel works. Flowing water strikes the paddles on the outer rim, creating a force that turns the wheel. Arrows indicate continuous rotation as water enters and exits the blades. The rotating wheel can transfer motion through its central axle to perform useful work, such as grinding grain or producing mechanical power. The illustration emphasises the link between moving water and rotation. Overall, it shows renewable energy in action.
Question 6:

Answer 6:
The image presents a tree growth system with key parts labelled. Underground roots spread widely to absorb water and minerals and anchor the plant. Above ground, the trunk provides strong support and transports nutrients upward. Branches and smaller twigs extend outward to hold leaves and capture sunlight. Leaves drive photosynthesis, producing food for growth. The diagram clarifies how each part contributes to survival. Overall, it explains the tree’s structure and function.
Question 7:
Answer 7:
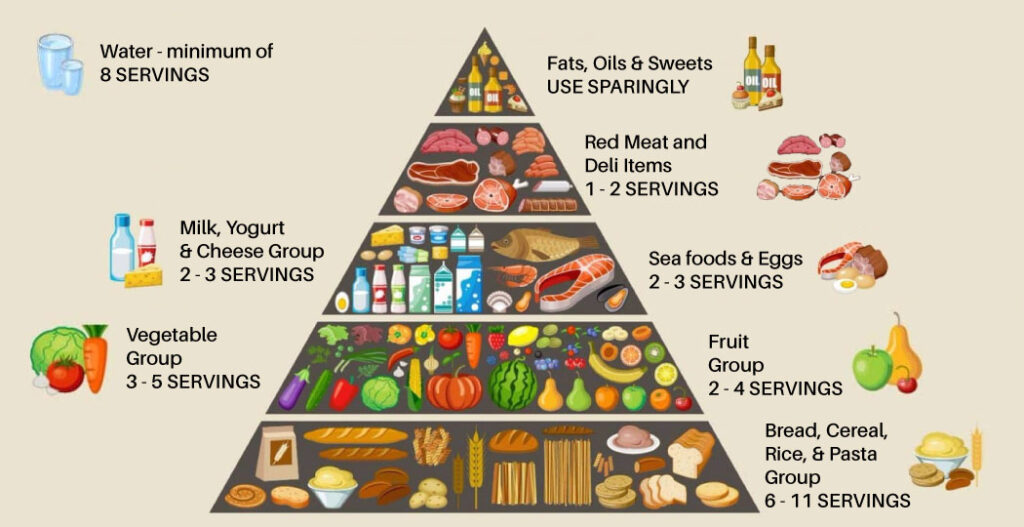
The food pyramid displays a balanced diet using serving ranges for each group. At the base, bread, cereal, rice, and pasta are recommended at 6 to 11 servings. Above that, vegetables need 3 to 5 servings and fruits 2 to 4 servings. Dairy, like milk, yoghurt, and cheese, is 2 to 3 servings, and seafood and eggs are also 2 to 3 servings. Red meat and deli items are limited to 1 to 2 servings, while fats and sweets are used sparingly, with water at a minimum of 8 servings. Overall, it guides healthy daily eating choices.
Question 8:
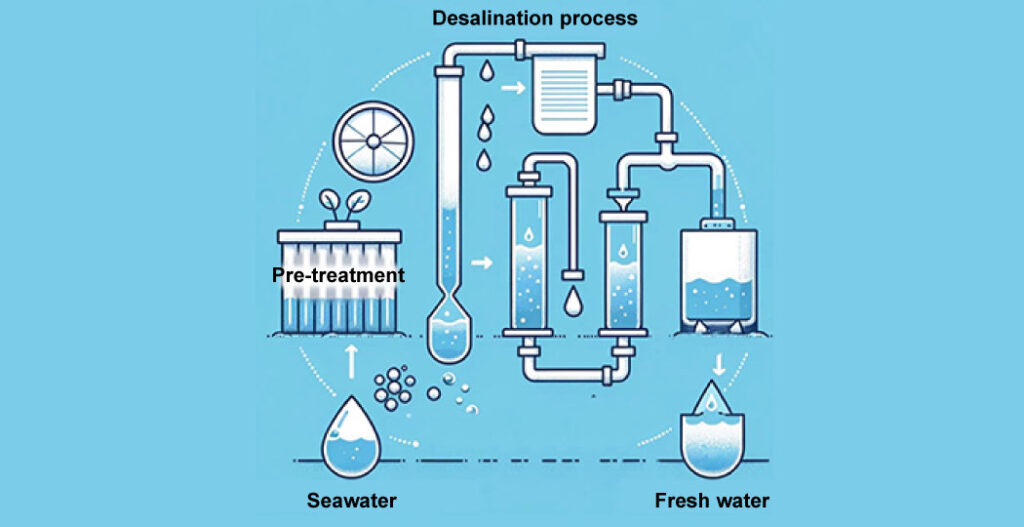
Answer 8:
This diagram illustrates the desalination process, turning seawater into fresh water. On the left, seawater enters a pre-treatment stage where impurities are removed. The water then moves through a series of connected pipes and filtration units, likely representing membranes or filters that separate salt and particles. Finally, clean water is collected in a storage tank and shown as a fresh-water output. The flow arrows make each step clear and sequential. Overall, it explains how filtration technology produces usable water.
Question 9:
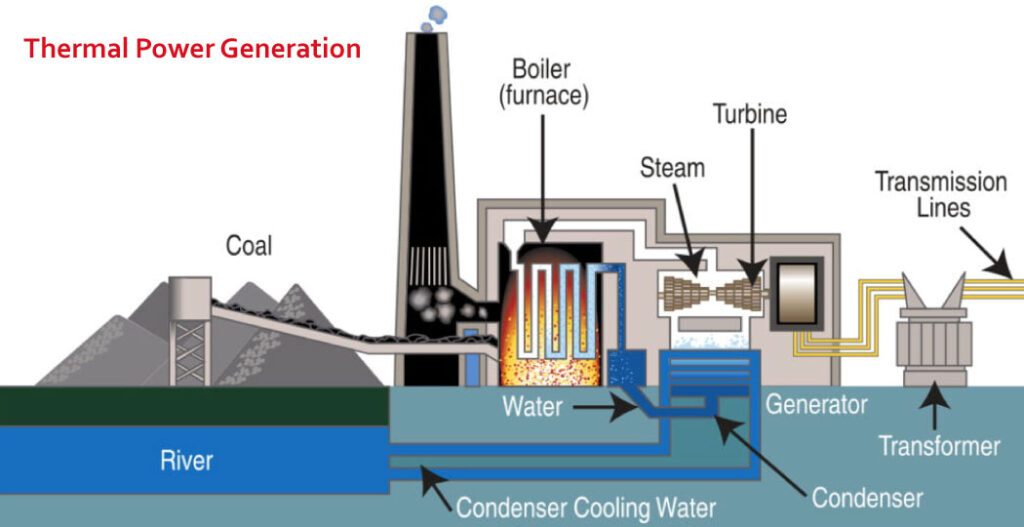
Answer 9:
The process diagram explains thermal power generation using a coal-based plant. Coal is fed into a boiler or furnace to heat water and produce steam. This steam drives a turbine, which turns a generator to produce electricity. The electricity is then stepped up by a transformer and sent through transmission lines. After the turbine, steam is cooled in a condenser using cooling water drawn from a river, and the cycle repeats. Overall, it shows energy conversion from fuel to electricity.
Question 10:

Answer 10:
The diagram illustrates a writing process arranged in a circular cycle. At the top, topic selection sets the foundation, followed by preliminary research to understand the current state. Next, outline and structure development and an extensive literature review build a theoretical base. After data collection, writing and integration lead into revision and editing. Proofreading checks the final draft before repeating the cycle. Overall, it highlights writing as iterative improvement.
For complete PTE preparation, 79Score offers full-length mock tests with AI-powered scoring. You can also practise with section-wise tests and predictive questions. These tests help you get familiar with the exam format and understand your performance. Regular practice can help you identify weak areas, improve your approach, and aim for a higher PTE score.
FAQ:
What is a process chart in PTE Describe Image?
A process chart shows the different stages of a process in a clear sequence. In PTE Describe Image, you need to explain the main stages in order using simple and connected sentences.
What is the difference between a process chart and a flow chart in PTE?
In PTE Describe Image, process charts and flow charts are essentially the same. Both show a series of steps or stages in a particular sequence. You can use the same approach to describe them clearly and logically.
How many stages should I describe in a PTE process chart?
There is no fixed number of stages you must describe. Focus on the key stages and explain them in a logical order within the given speaking time. Avoid trying to describe every small detail.
What is the best template for a process chart in PTE Describe Image?
A simple structure works best: introduce the process, describe the main stages in sequence, and give a brief conclusion if time allows. The template should help you organize your ideas rather than make your response sound memorized.
Also Read:
- Crack PTE Pie Chart Questions – Tips, Template & Samples
- PTE Describe Image Template – Tips, Predictive Questions & Answers