|
79Score
Getting your Trinity Audio player ready...
|
It is vital to know how to read and describe data for PTE success, particularly for the PTE bar graph. The PTE bar graph is a part of the PTE academic exam which challenges your skills and abilities to describe the data and to express them in a clear and a concise manner. This is followed by a PTE bar graph template; we share all tips that you might find useful for you to solve this task as well as provide some sample questions for the PTE bar graph with answers. You can also practice more of these questions on 79Score’s PTE mock test with answer.
PTE Bar Graph Template
Having an effective PTE Bar Graph template may make you complete the PTE bar graph task quickly and easily. You can use the structure mentioned below.
- Introduction: Introduce the PTE Bar graph briefly by saying what it shows. Include what it covers, the time period, the types of data.
- Main Features: Describe the key characteristics of the graph in terms of major trends and similarities or differences. Employ comparative language and indicate whether things went up, went down or stayed the same.
- Specific Data Points: Identify relevant numbers. For example, say the greatest and the least amounts or other notable numbers.
- Conclusion: End by Summarising your findings or providing some inference or projection related to the data.
Say, for instance, the bar graph represents sales data over five years. Your introductory statement may state what years are included and what products are being sold. The major features may be the trend lines of sales of Product A and Product B. In terms of the data points, Product A had the highest sales in 2022 while Product B has seen a consistent growth. Finally, the conclusion may include comments on the direction or the direction the sales are heading in the graph.

Tips to Attempt the PTE Bar Graph
Here is what you need to describe a PTE Bar graph accurately:
- Use key words: Learn the words such as rise, fall, drop, grow, remain constant to talk about change in numbers.
- Practice as much as possible: Practice with different bar charts. The more you try, the more confident you’re with the data representation.
- Time yourself: Plan your time. Look over the graph first before beginning to write. It will give you enough time to construct a solid response.
- Brevity: Only include relevant information and don’t waste words. Write short and sweet.
- Use comparisons: Compare and contrast the bars. It helps you present the information comprehensively.
These tips will help you answer questions about a bar graph efficiently. The final product should be one that communicates your thoughts about the data to a person who has never seen the data before.
PTE Bar Graph Sample Questions with Answers
Below, we give you two examples of questions along with responses in an attempt to provide examples of how to apply your PTE bar graph template and tips:
Sample Question 1:

Description:
The bar chart compares estate sales units across five major cities, namely New York, London, Tokyo, Paris, and Sydney. Overall, New York records the highest sales at just over 300 units, while Paris shows the lowest figure at around 260. Tokyo and Sydney display similar performance, with approximately 290 and 280 units respectively. London follows slightly behind Tokyo. In general, sales remain relatively high across all regions, indicating strong real estate activity.
Sample Question 2:

Description:
The bar chart compares pollutant emissions produced by different industrial sectors. Manufacturing records the highest emissions at around 300 units, followed by transportation at approximately 250 units. Utilities also contribute significantly, with just over 210 units. In contrast, construction emits about 150 units, while agriculture shows the lowest level at nearly 110 units. Overall, the chart highlights that heavy industries and transport are the major sources of pollution.
Sample Question 3:

Description:
The bar chart illustrates passenger preference percentages for five air routes. The highest preference is for LA to Tokyo at about 90%, followed by NY to London at roughly 85%. NY to Paris is around 75%, which is slightly lower than SF to Sydney at approximately 80%. Boston to Berlin records the lowest preference at close to 70%. Overall, long-haul routes remain popular, with all routes preferring above 70%.

Not sure where you stand? Take a free PTE mock and find out instantly


- Get a complete performance breakdown instantly
- Access 30,000+ Free Question Wise Practice
Sample Question 4:
Description:
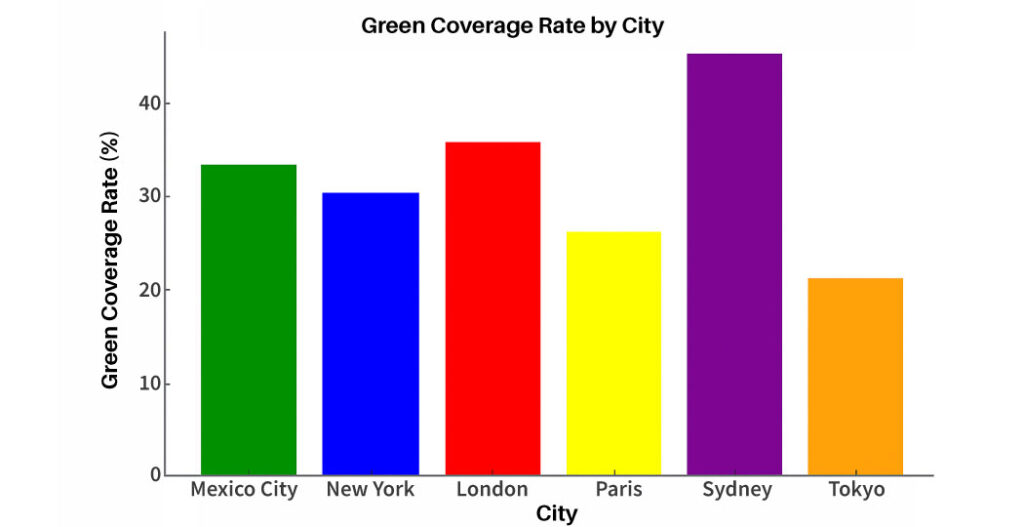
The bar chart compares the green coverage rate across six major cities. Sydney records the highest proportion at about 45%, followed by London at roughly 36% and Mexico City at around 33%. New York shows a moderate level near 30%, while Paris stands lower at approximately 26%. Tokyo has the least green coverage, at just over 20%. Overall, the chart highlights significant variation in urban green spaces.
Sample Question 5:

Description:
The bar and line graph illustrate the change in weekly working hours across three industries: Technology, Healthcare, and Education. In Week 1, Healthcare had the highest working hours, followed by Technology and Education. In Week 2, Healthcare and Technology showed a slight decrease, while Education had a minor drop. The red dotted line indicates a significant decline in Technology and Healthcare, while Education remained relatively stable. Overall, the graph highlights fluctuations in working hours across industries.
Sample Question 6:

Description:
The bar chart illustrates gift purchase trends across four major holidays, measured in units of ten thousand. Christmas records the highest number of purchases at around 120 units, showing a clear peak in consumer spending. Mother’s Day follows with approximately 90 units, while Valentine’s Day accounts for about 80 units. Father’s Day has the lowest figure, at roughly 70 units. Overall, the chart highlights that gift purchasing is strongest during Christmas and comparatively lower for other personal celebration days.
Sample Question 7:

Description:
The bar chart compares the number of applicants across four academic majors, measured in 000. Business receives the highest number of applications at about 150 000, showing strong demand. Engineering follows with roughly 120 000 applicants, while Medicine attracts around 80 000. Arts has the lowest figure at approximately 60 000 applicants. Overall, the chart indicates that business and engineering are the most popular choices among students.
Sample Question 8:

Description:
The bar chart illustrates weekly broadcast hours for five program types. News records the highest airtime at about 25 hours per week, followed by sports with 20 hours. Drama stands at nearly 15 hours, while comedy receives around 10 hours. Documentary is the lowest category at only 5 hours per week. Overall, news and sports dominate the weekly schedule compared to other program types.
Sample Question 9:

Description:
The combination chart illustrates donations to the Red Cross and UNICEF from 2019 to 2022. The Red Cross donations, represented by red bars, show a steady increase from approximately 100 million dollars in 2019 to over 200 million dollars in 2022. UNICEF donations, shown by the blue line, also follow an upward trend, starting from around 100 million and reaching nearly 200 million in 2022. Overall, the chart suggests continuous growth in charitable contributions to both organisations over time.
Sample Question 10:

Description:
The bar chart illustrates the facility completeness percentages across five schools. School A and School C have the highest completeness rates, both exceeding 85%. School B follows with approximately 75%, while School D has the lowest completeness at around 60%. School E also has a relatively lower percentage, slightly above 65%. Overall, the chart highlights differences in facility development across institutions.
Practice PTE Describe Image Questions
Understanding how to describe a PTE bar graph involves reading the data in a pictorial form as well as communicating your findings accurately. By adhering to your PTE bar graph template and using the tips above, you’ll have the confidence to answer all PTE bar graphs. You should also take advantage of the opportunity to do several practice exercises in preparation for the PTE bar graph. Check out 79Score for more practice questions and resources to help you pass the PTE exam.
FAQ:
How much is 46 in PTE score?
A score of 46 in the PTE Academic roughly corresponds to about 5.5 to 6 bands in the IELTS. It indicates a moderate level of English proficiency where the test taker can handle everyday communication but may still make noticeable errors in complex situations.
How much is 7 bands in PTE?
A 7 band score in IELTS is generally equivalent to around 65 to 72 in PTE Academic. This level reflects a good command of English with the ability to understand and communicate effectively in most academic and professional settings.
Is 1 month enough for PTE?
Yes, one month can be enough to prepare for the PTE Academic if your basic English skills are already decent. With consistent daily practice focusing on speaking, listening, reading, and writing, many test takers can achieve their target score within this timeframe. However, beginners may need more time.
Is PTE harder than IELTS?
The difficulty depends on your strengths. PTE Academic is fully computer based and uses AI scoring, which suits people comfortable with technology and fast responses. IELTS includes a face to face speaking test, which some find easier. So neither is objectively harder, it depends on your preference and skills.
Is PTE valid for 2 or 3 years?
The PTE Academic score is generally valid for 2 years.
Also Read:
- Guide for PTE Marks Distribution
- Learn 60+ PTE Dictation Words To Score 79+
- PTE Vocabulary List – The Complete Guide To Score High in All Tasks